5 Simple Changes in Power BI to Reduce Data Model Size by 99%🤩
Yes, its possible and here is how you can do it.

When you work with large data models, one thing that bothers us the most is the performance of the reports. As a Power BI Architect, I have worked on a variety of data models — from small ones with just hundreds of rows to larger ones with up to billions of rows. And guess what, the most common ask from any client is that they want a dashboard with optimized performance.
Though there are multiple ways to optimize the performance of a data model, the primary thing is to reduce its size. Power BI models in Import mode are loaded with data that is compressed and optimized and then stored to disk by the VertiPaq storage engine. When source data is loaded into memory, it’s possible to see up to 10x compression.
Despite VertiPaq storage engine efficiency, it’s important that you take steps to minimize the data that is loaded into your models.
This can be done in really simple steps. Here, I list down 5 very simple methods to do so. I’ll be using DAX Studio and VertiPaq Analyzer to demonstrate before and after analysis on the changes.
I am using the sample Sales dataset to demonstrate this. So, here is the scenario: You are tasked to create dashboards using the dataset that fulfills the below criteria:
- Sales analysis on the data from year 2016–2020.
- Sales analysis needed at the month and year level.
- KPIs for Cost, Revenue and Profit calculations across available dimensions.
Before we start, here is the snapshot of the dataset file size and VertiPaq engine analysis result:
 |
| Original file size |
Power BI file size is ~ 169 MB
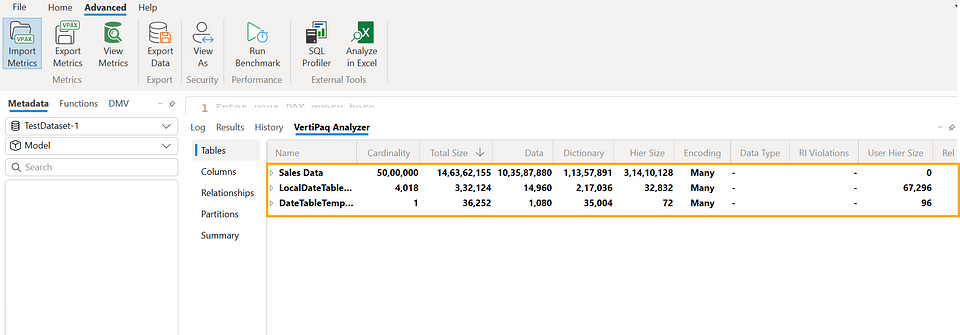 |
| Vertipaq Analyzer in DAX studio |
Note: The steps that I am showing here are in no particular order, to keep the rhythm of writing this blog and to have a surprise element.
Change 1: Turn off the Auto Date/Time
As you can see in the Vertipaq Analyzer snapshot above — at the beginning itself it is showing 3 tables. But we know that we only loaded the sales data table.
The other two table that we see are created due to Auto Date/Time feature of Power BI. You need to turn this feature off if you already have a date field in your data, otherwise that will mess with the report performance
To turn it off : Go to File → Options and settings → Options. Current File → Data Load settings, uncheck the Auto Date/Time checkbox under Time intelligence.
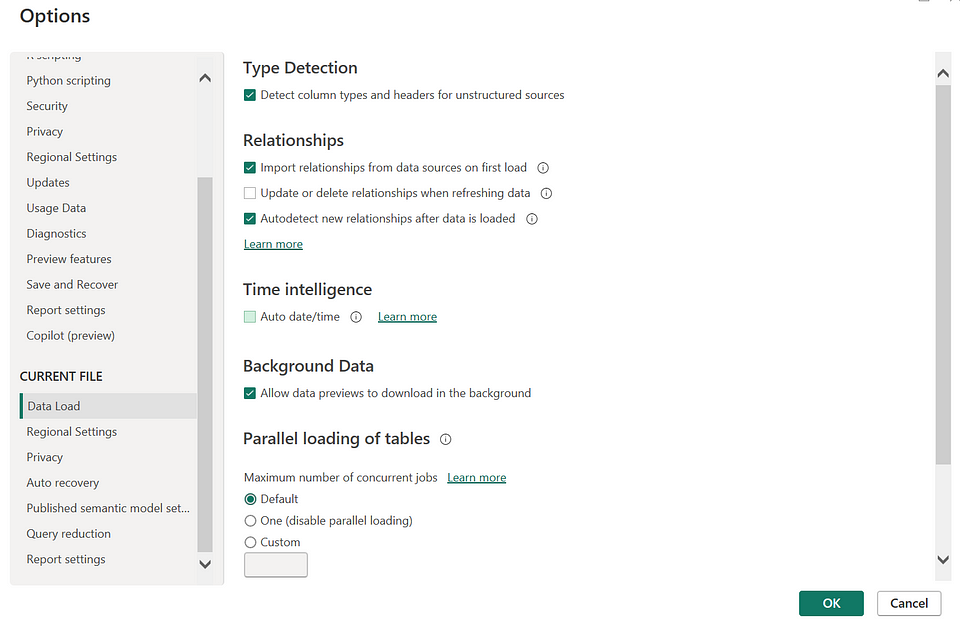 |
| Turn off Auto date/time under Options and settings |
Once done, save the report, close and open it again. Now, lets see the change in file size and Vertipaq engine analysis.
I have saved the file with new name — TestDataset-2 and you can see the current file size is now under 169 MB, although a minimal decrement but an important one.
 |
| File size after the first change |
Now if we have a look at the VertiPaq engine analysis, it now shows only one table, i.e., the Sales Data table.
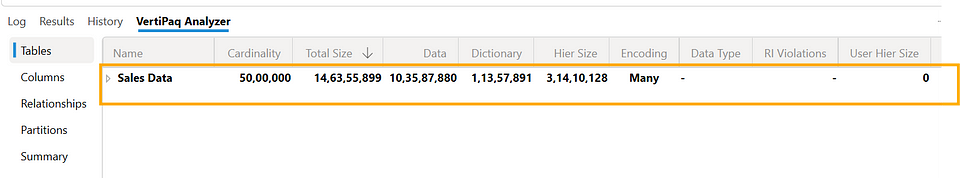 |
| Vertipaq engine analysis |
Change 2: Remove Unnecessary Columns
This can be considered another important step. You need to understand what all fields are needed for the reporting purposes.
In this case, since we are creating Sales data analysis dashboard, we should keep only the relevant fields.
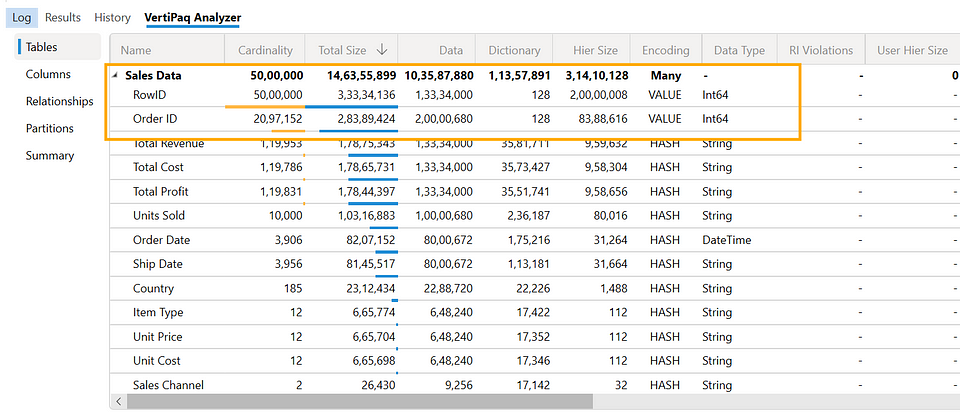 |
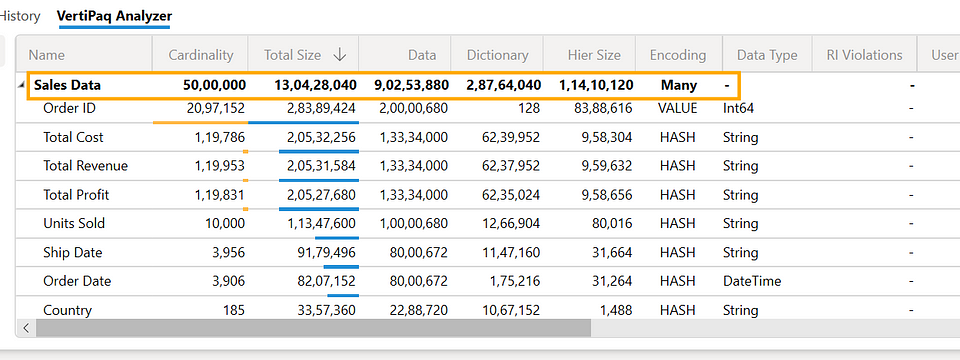
| Vertipaq Engine analysis before the change |
As you can see in the Vertipaq Analyzer metrics, two high cardinality columns which are taking a lot of space are [RowID] and [OrderID] columns. For analysis purpose, we may not remove the [Order ID] column but [RowID] column can definitely be removed. Its of no use in the Sales analysis dashboard.
So, let’s remove the [RowID] column and check how it changes the file size.
Make sure you remove the the columns that are not needed before loading the data in Power BI, otherwise removing them after loading will make no sense.
 |
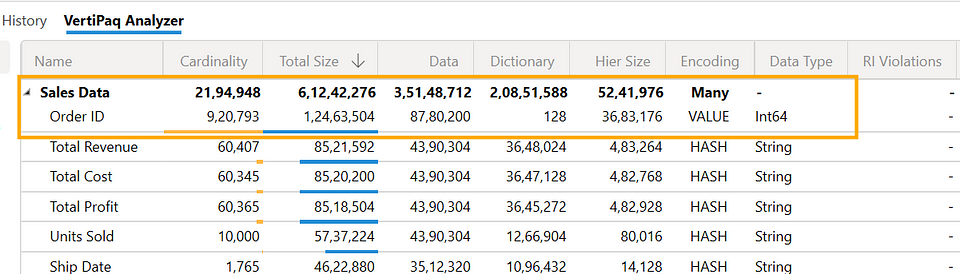
| Vertipaq Engine analysis after the change |
As you can see the in vertipaq analysis, the Total Size has reduced. If you look at the file size below
 |
| File size after the change |
It has reduced from 168 MB to 109 MB, close to 40% reduction. This huge reduction in size is mainly attributed to the fact that we have removed the column that had the highest cardinality in the table. Since [RowID] is unique for each row, there were 50,00,000 unique values for it, which was same as the overall table cardinality. Keeping that column was unnecessary hence, it was better to remove it.
3. Remove Unnecessary Rows
The Sales dataset in contains order details from year 2010 to year 2020. But in this case the requirement is to analyze data from 2016 to 2020 only. So, we have to pull data where the year is greater than or equal to 2016. Let’s do that and see how that changes the file size.
Here, I’d like to mention that if you are filtering the rows, do that as the first step, so that you don’t bring in unnecessary data into the model. Since I am demoing here, I did it in the 3rd step to show its impact on the model size.
 |
| Vertipaq engine analysis after filtering data |
As expected, the Total Size and Cardinality for the dataset is reduced now. And the same reflects in the file size also:
 |
| File size after the change |
Now, can we further reduce the model size? The answer is Yes. Lets do that through the next steps.
Method 4: Use the Appropriate Data Types
This is another important step to reduce the model size. You need to identify fields that don’t have relevant types and then change data types accordingly.
For example, in this case, several fields such as Units Sold, Unit Cost, Unit Price, Total Cost, Total Profit, and Total Revenue, all were in Text data type as you can see below:
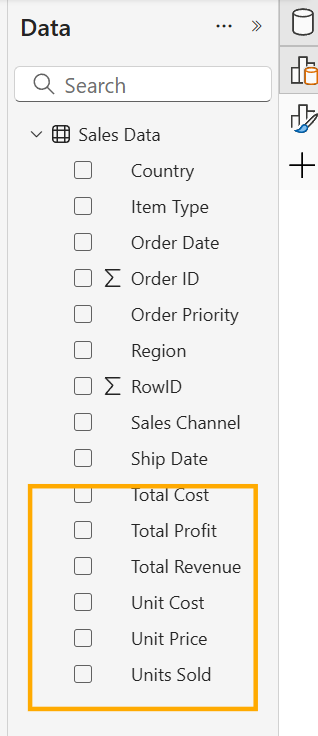 |
| Text Data Types of numerical data |
Since these are all numeric values, we’ll convert them to relevant data types. Units Sold can be converted to Whole Number and the rest of the fields can be converted to Fixed Decimal Number.
Once you are done with the changes, this is how the Data View looks:
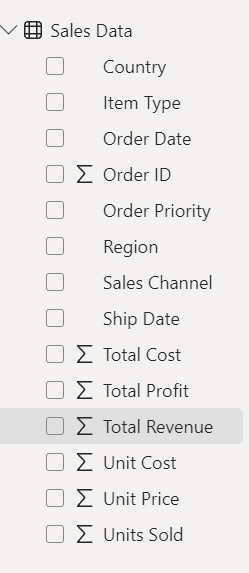 |
| Data View after data type change |
Now, lets see the impact of this to the file size.
 |
| Change in file size after the change |
As you can see, there is minor change in the size, from 36.6 MB to 36.5. It is a very small change here because the data volume is not that huge, but imagine having millions of rows. In such cases, having relevant data types is of paramount importance.
Now, the next and the last change that I am going to discuss can reduce the data model size drastically. Let’s check that!
Method 5: Aggregate the Data
This is helpful with any connection type — Composite, DirectQuery, or Import. This can optimize your report performance if you are dealing with large data volumes.
We have already achieved almost an 80% reduction in model size. As a further step, we can also consider what reporting analysis are we trying to do.
I this case the — idea is to do monthly analysis on sales data. Hence instead of loading all the data, we’ll aggregate the table at the month level and and then load. We’ll also pull only necessary fields that are needed from the reporting purposes.
As you can see from the screenshots below from the query transformation window — after extracting Month Year from the order date, I have aggregated the data:
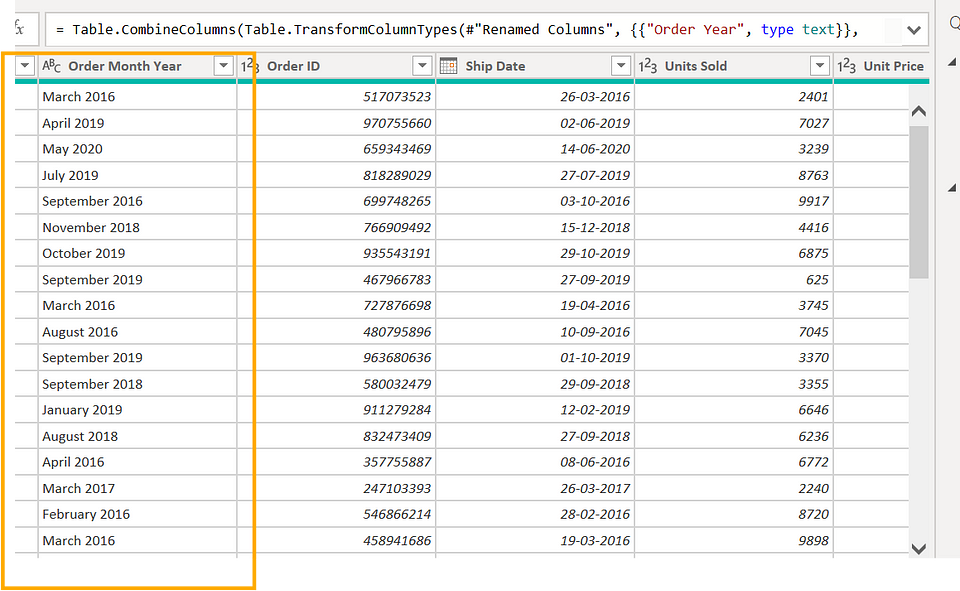 |
| Extracting month and year from date |
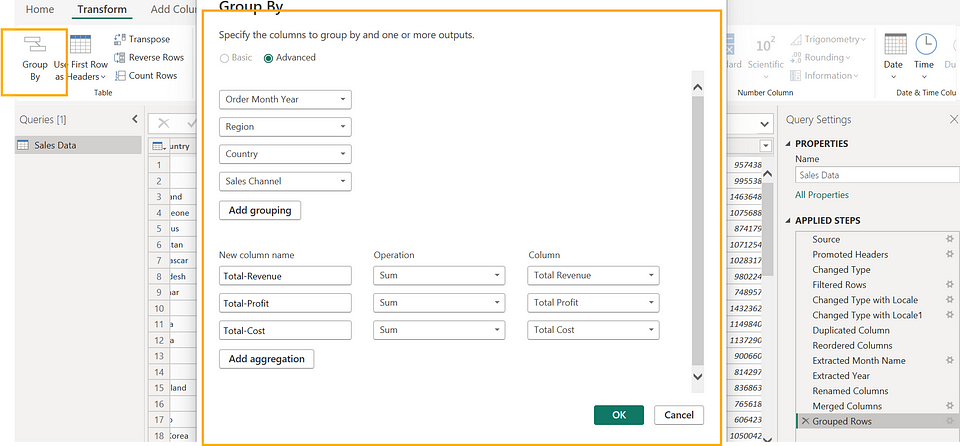 |
| Group By on Month Year and other fields |
Once you are done loading the changes, you are in for a surprise!!!
Here is the updated file size after the aggregation transformation:
 |
| File size after the aggregation |
Conclusion
And here we are, towards the end of this piece. Having an optimized data model is a luxury that every BI developer would like to have but not everyone can achieve. In this blog, I tried to highlight 5 simple changes that can drastically reduce data model size, which in turn can result in a better-performing data model and reports.
I hope you enjoyed reading this piece and got something out of it. Do share your thoughts in the comments!
If you find my blogs valuable and want to support — Buy Me A Coffee
or click the image below 👇.
 |
| Thank You!!! |
Follow me here 👇:

Valuable perspective on the rising importance of business intelligence in today’s data-centric world! To transform complex data into meaningful business insights, it’s essential to Hire Power BI Developers with the right skills. HireFullStackDeveloperIndia provides experienced BI professionals to help maximise the value of your data analytics initiatives.
ReplyDelete